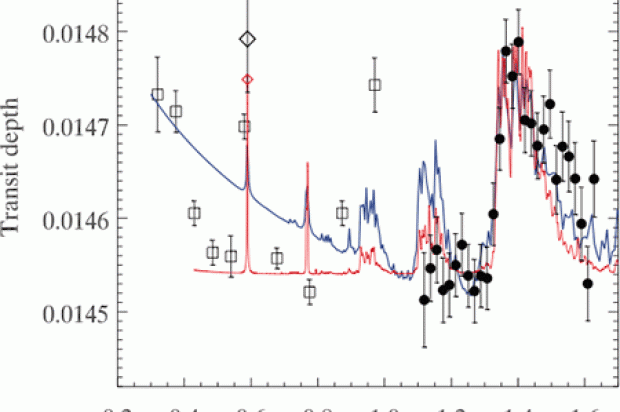
Figure ii: An example exoplanet transit transmission spectra, that of the hot Jupiter HD 209458b. The spectrum is shown as the transit depth as a function of wavelength, equivalent to an increase in the planet’s area as projected on the star. At wavelengths of prominent atmospheric atomic and molecular absorption, the planet appears larger; and at wavelengths where the planet atmosphere is transparent, the planet appears slightly smaller. The observations (black points) from the Hubble Space Telescope WFC3 show a strong absorption peak due to water vapor at 1.4 microns. The open symbols are from the Hubble Space Telescope STIS and are largely inconclusive. The colored solid lines are illustrative models, the blue one with a Rayleigh scattering type of haze absorption and the red one with a wavelength-independent small amount of absorption other than molecular gases. Many exoplanet transmission spectra show only a flat line, implying clouds completely dominate the wavelength region accessible. Most exoplanet transmission spectra are in the region of 1.1 to 1.7 microns thanks to HST WFC3. Figure from Deming et al. (2013).


