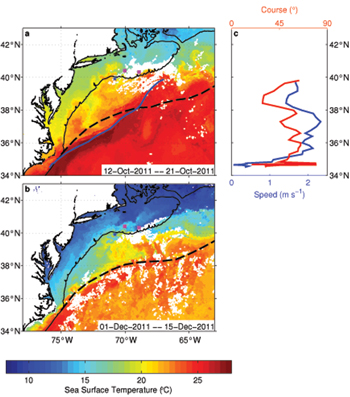
The figures show the maximum sea surface temperatures for the periods (a) October 12–21, 2011, and (b) December 1–15, 2011. The coastline and shelfbreak are indicated by the thin black contours. The dashed black lines in (a) and (b) denote the climatological mean location of the Gulf Stream North Wall in October and December. In (a), the blue line denotes the path of a surface drifter released off Cape Fear, NC, on October 12, 2011, that was entrained in the Gulf Stream and reached Georges Bank 8 days later. The drifter’s speed (blue) and course (red) are shown as functions of latitude in (c). In (a–b), the blue star indicates the location of the OOI test mooring, and the magenta squares denote the locations of the eMOLT observations.

