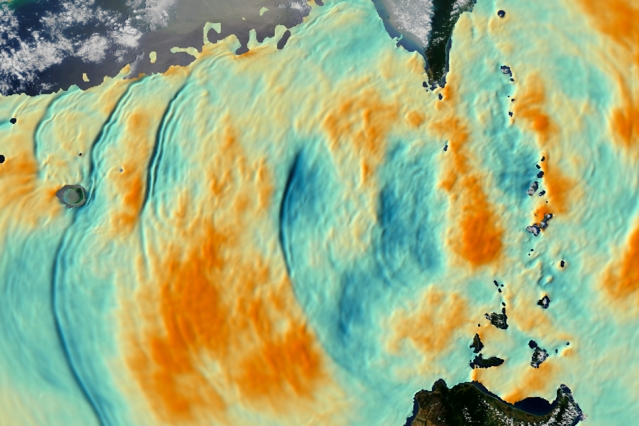
Satellite image of the South China Sea with colors added to indicate the calculated vertical displacement of ocean layers near 200 meters deep, based on simulated model data and calculations run by Harper Simmons at the University of Alaska at Fairbanks and depicted by a graphics team at the University of Washington. Orange indicates upward movement, and blue indicates downward movement. Satellite image of the South China Sea with colors added to indicate the calculated vertical displacement of ocean layers near 200 meters deep, based on simulated model data and calculations run by Harper Simmons at the University of Alaska at Fairbanks and depicted by a graphics team at the University of Washington. Orange indicates upward movement, and blue indicates downward movement.

