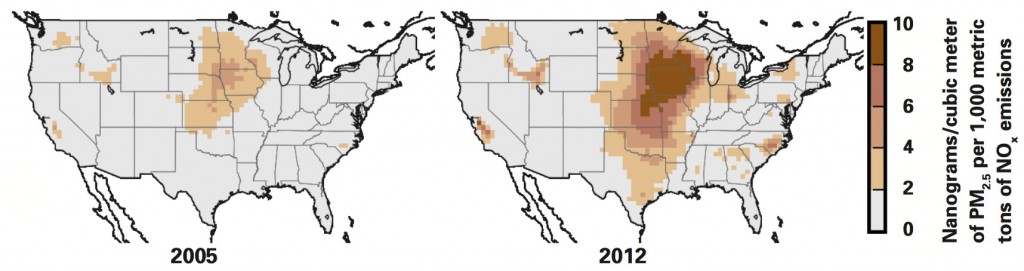
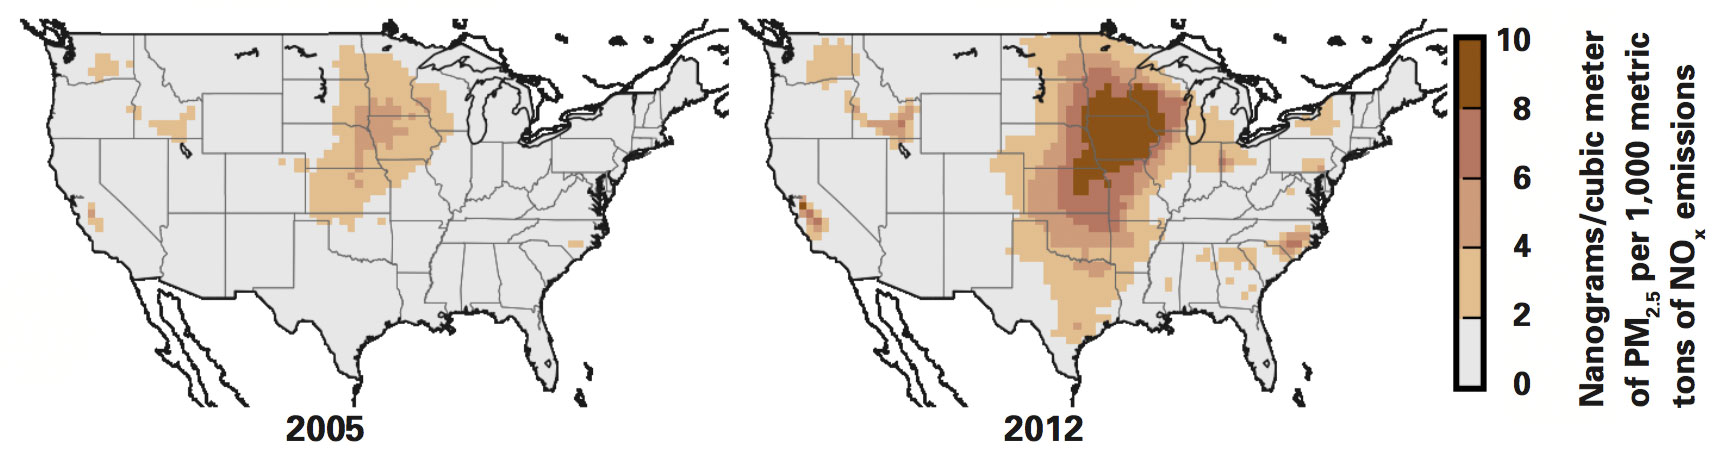
These maps show sensitivities of PM2.5 concentrations to emissions of NOx at locations across the United States in winter of 2005 (left) and 2012. The darker the color, the greater the concentration of PM2.5 formed for every 1,000 metric tons of emitted NOx. In general, sensitivities are higher in 2012 than in 2005. Therefore, reducing NOx emissions now would bring an even larger reduction in PM2.5 than it brought in the past.

