Featured Stories | March 25, 2015
Closing the Arctic Data Gap
By Cassie Martin
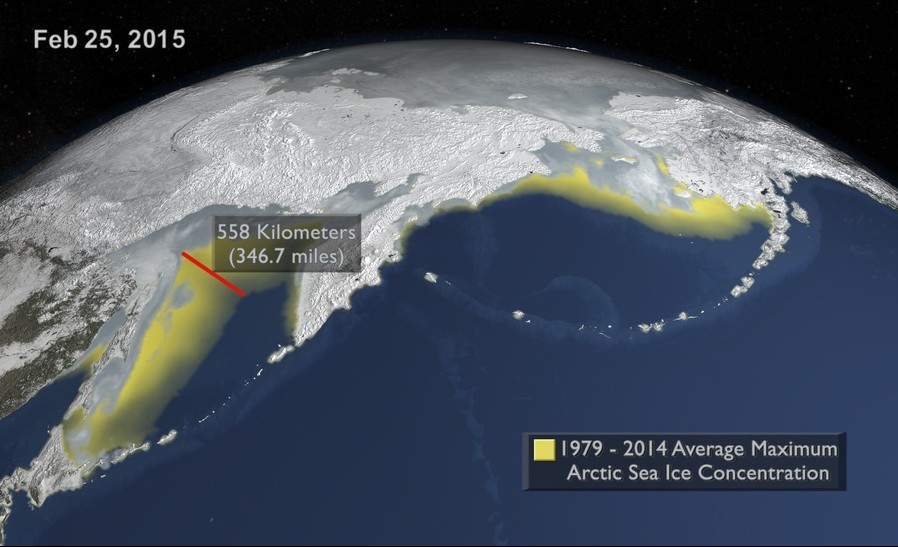
Last week, the National Snow & Ice Data Center (NSIDC) announced winter ice covering the Arctic Ocean reached its annual peak, ushering in the spring melting season. But the extent of sea ice cover was the smallest since record-keeping began in 1978.
Covering approximately 5.6 million square miles of the northern seas, the ice was 425,000 square miles below the 1981 to 2010 average and about 50,000 square miles below the previous lowest maximum extent that occurred in 2011.
As ice disappears, the ocean underneath absorbs more heat, further accelerating melting. Sea ice loss already affects the entire Arctic ecosystem including organisms such as polar bears and phytoplankton that depend on the ice, the ocean environment, and even weather patterns across the Northern Hemisphere. But to what extent is the ecosystem impacted, and what might it look like in the future?
Scientists have been working for years to answer these questions, but the Arctic’s harsh environment often prohibited gathering long-term data on this delicate ecosystem. Until recently, satellites and sampling from ships and submarines were the only sources of information on this ice-covered region, but provided only snapshots of a small area at a single moment in time. Now, thanks to an innovative device designed to drift around the Arctic on sea ice, researchers are closing critical data gaps and gaining a better understanding of how the Arctic Ocean is responding to climate change.
“Ice-tethered profilers (ITPs) are helping us on two fronts,” said John Toole, an oceanographer at Woods Hole Oceanographic Institution (WHOI) and ITP architect. “One is trying to better understand the ocean’s role in shrinking ice cover and the other is thinking about what the implications are for the upper ocean and the ecosystem in the Arctic.”
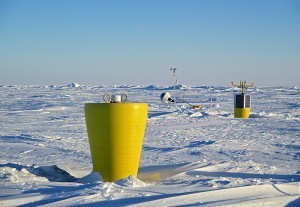
First developed in 2004, WHOI has deployed more than 80 profilers to date and tries to maintain approximately 20 profilers across the Arctic at all times. Large, bright yellow buoys anchored atop ice floes support weighted cables that extend 800 meters down into the freezing water. Attached to the cables are motorized “profiler” units. Equipped with a variety of sensors, these profilers move along the entire length of the cables measuring anything from temperature, pressure, and salinity to dissolved oxygen content, ocean currents and fluorescent chlorophyll produced by phytoplankton. The data are sent to electronics in the buoys, which transmit the information back to WHOI in near real time via satellite.
Profilers collect and send data for up to three years, after which their batteries fail, underwater components break, or ice crushes them. Researchers are able to recover and refurbish some units if the cost of recovery doesn’t outweigh the benefit, but many are too damaged or lost to the depths of the Arctic Ocean. Still, three years’ worth of continuous data is a vast improvement. “ITPs in that sense are revolutionizing arctic research and polar research in general,” said Patrick Heimbach.
Modeling the Arctic’s Future
A physical oceanographer in EAPS and MIT’s Program in Atmospheres, Oceans, and Climate, Heimbach mainly focuses on ocean circulation and its role in the global climate system. However, he also uses modeling to investigate the dynamics of Arctic sea ice, polar ice sheets, and polar oceans. “For us, the main importance is really that we start to constrain what the ocean has actually been doing, how it’s changing under the ice, and how its changes may be affecting the ice,” he said. “And ITPs are helping us do that.” In other words, he uses the data collected by ITPs to fit models within real world parameters. But it’s not as easy as it sounds.
For the last few years, Heimbach, together with research scientist An Nguyen and his team, has been developing an Arctic-focused version of their global ocean modeling and state estimation system called ECCO (Estimating the Circulation and Climate of the Ocean)—a computationally intense endeavor that requires the use of NASA supercomputers. “We are just getting to the stage of looking into the details of what the trajectory we are computing tells us,” he said. “It’s complicated in that it involves not just the forward model, but a model that essentially runs backwards in time.” This backwards model acts as a fact-checker, comparing the forward model’s data against observed past conditions. If the differences are too large, the system methodically adjusts uncertain variables such as surface forcing and other model parameters, so the forward model better fits the data.
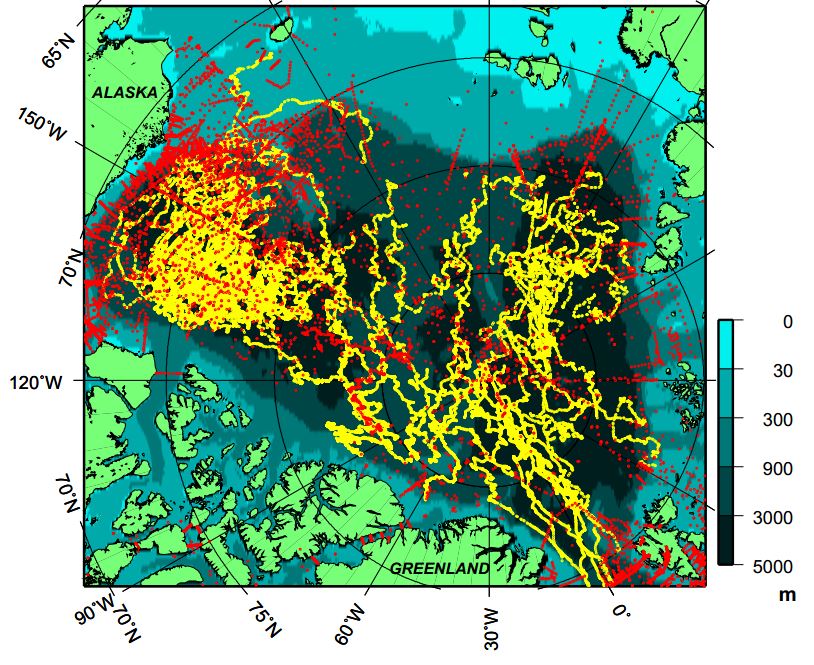
In order to get a more complete picture of Arctic Ocean and sea ice changes from their model, Heimbach and Nguyen also incorporate satellite data, limited data sets collected by researchers out in the field, as well as more robust data sets from moorings that stay in the water for extended periods of time. “We’re trying to see whether all of the different data sets tell a consistent story, and what story the model tells us about unobserved parts,” Heimbach said. Their team is just beginning to see results.
Data from profilers aren’t just used to model the Arctic Ocean of the future, WHOI researchers and others from around the world use it to understand changing dynamics happening right now. For example, John Toole and colleagues recently published studies that used ITP data to examine eddies, ice flow, internal waves, mixing and turbulent fluxes underneath sea ice, to name a few. These findings not only tell scientists about the current state of the Arctic Ocean, but also give a boost to modelers like Heimbach and Nguyen by providing them with highly detailed, small-scale observations they can incorporate into their models.
The Road Ahead
Although ITPs provide researchers with unprecedented access to the Arctic, the technology has a few drawbacks. Profilers rely on ice to carry them around the Arctic Ocean, but as ice cover shrinks so does the devices’ range. “Now that we have thinner ice and less ice, we need extensive measurements in areas that are now in open ocean,” Nguyen said, adding “At the moment, ITP data set offers an incomplete picture because it only takes measurements underneath relatively thick ice”. But even those under-ice measurements are limited—important ocean-ice interactions take place within the first few meters of ocean underneath sea ice, but profilers cannot measure water properties there because they could potentially be crushed.
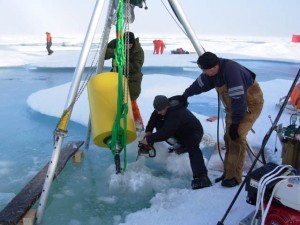
However, John Toole and WHOI engineers are working to fix some of these issues. Not only are profilers able to float should ice melt, “in fact, we have now deployed several in open water and they have survived fall freeze up and went on to function like conventionally-deployed systems,” said Toole. And thanks to a growing monitoring network, where ITPs fall short other technologies like moorings and satellites are there to fill in the gaps. “Given the dramatic changes that have already occurred this century, including the record maximum ice extent just reported by NSIDC, we must continue to observe the oceans to document what those changes are and their consequences,” he said.


