
Featured Stories, MIT, WHOI | December 10, 2012
The DIMES Experiment: Searching for Clues to Climate in Southern Ocean Eddies
by Genevieve Wanucha
The vast Southern Ocean constitutes a major limb of the upwelling branch of the ocean’s conveyor belt in which water sinks down in the cold areas of the northern North Atlantic and then slides up to the surface around Antarctica in the South. It takes many hundreds of years for a water parcel to make a complete transit. This ‘overturning circulation’ brings up vast stores of carbon and heat stored in the ocean’s interior to interact with the atmosphere, thus deeply affecting the present and future climate.
It doesn’t take a long conversation with a researcher who studies this cycle to realize there’s no hope of understanding of long-term climate change without an understanding of the Southern Ocean circulation.
“The temperature of the Southern Ocean and the amount of CO2 in the atmosphere follow one another,” says Andrew Watson, professor of environmental sciences at the University of East Anglia. “And, the natural cycle of CO2 in the atmosphere is absolutely 100% tied to the circulation of the Southern Ocean.” However, current models that make long-term climate change projections are compromised by uncertainties in representing the Southern Ocean.
A collaborating group of American and United Kingdom researchers are working to solve this problem with a project called DIMES, a.k.a. the Diapycnal and Isopycnal Mixing Experiment in the Southern Ocean.
The group’s catchy acronym refers to the two ways that turbulence mixes the ocean’s interior. To grasp the concept, envision the layers of ocean water like pages of a book, but ones that are curled upwards along one edge; these tilted pages are ‘isopycnals,’ or surfaces of constant density, along which ocean properties are carried by ocean currents. The curled up pages represent the isopycnals rising up from the interior to the ocean’s surface around Antarctica. Thus, the important distinction: ‘diapycnal’ mixing moves water across the isopycnal surfaces (i.e., across one page to another). ‘Isopycnal’ mixing stirs water laterally along the tilted surfaces (keeping on page).
Mixing along isopycnal surfaces is carried out by ocean eddies, the equivalent of atmospheric weather systems. They are 10 to 100 km in scale and, along with wind, exert their power. Smaller cm-scale eddies create the diapycnal mixing. In their contrasting ways, these two forms of turbulence mediate the exchange of carbon and heat in the Antarctic Circumpolar Current. Thus, any computer model must get both scales just right to accurately model the amount of carbon and heat brought up in the rising deep water.
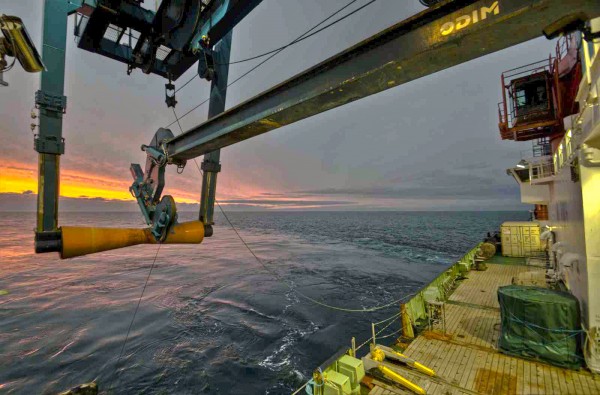
The problem is that the turbulent scales are, understandably, hard to observe with oceanographic tools, even harder to extrapolate over time and space in a computer model. That’s where DIMES comes in. To get around the observational challenges, DIMES researchers are tracking the mixing of a big chunk of the Southern Ocean with one 80-kg barrel of non-toxic dye.
Jim Ledwell, a chemical oceanographer at WHOI, and his long-standing UK collaborator Andrew Watson, a biogeochemist, have been perfecting this technique since 1982. The hard work paid off in February 2009 when Ledwell headed up the first US DIMES cruise into the Southern Ocean and released the tracer, CF3SF5, a mile deep into the circumpolar current, just upstream of Drake Passage. They will track the 3-D evolution of the dye as it is carried in currents over both the smooth bottom of the Southeast Pacific and the mountainous topography just downstream of Drake Passage and the Scotia Sea.
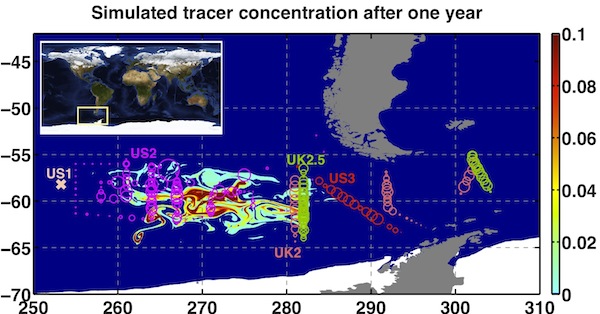
“It’s an amazing detective story,” says DIMES researcher John Marshall, professor of oceanography at MIT, “because this tracer just gets mixed all over the place in the turbulent ocean. It doesn’t just ooze out in a symmetric way but gets drawn out into complex filaments, which are very hard to map.” In fact, the dispersing tracer gets so diluted over time that Ledwell’s team must grapple with the equivalent of measuring a drop of milk mixed in an Olympic swimming pool after one, two and three years.
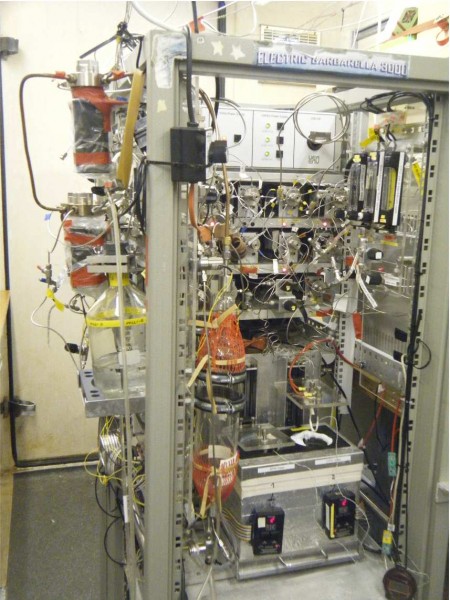
To accomplish the task, UK and US researchers track the tracer’s dispersion by collecting water at different depths and then measuring the tracer content with sensitive instruments. Eventually, they hope to analyze the oceanographic observations to better understand the mechanisms responsible for the horizontal stirring and vertical mixing of the tracer patch.
To complement the tracer data, Kevin Speer, professor of oceanography at Florida State University, deploys floats along the path of the tracer, which provide information about the spreading rates by ocean eddies. Other instruments drift with the water’s current, measuring temperature, conductivity (hence, salinity), and pressure. Free-falling profilers sample the cm-scale ocean turbulence, and instruments lowered from the ship sample the intermediate-scale motions that provide energy to the turbulence.
Preliminary data are showing just how much we have to learn about the Southern Ocean, which now appears to be mixing vertically at particularly high rates in regions of the ocean that flow over rough topography, perhaps due to the generation of the ocean equivalent of mountain lee waves in the atmosphere.
Between the US and the UK, six DIMES cruises have now been completed. They’ve hit plenty of obstacles, such as engine trouble and their fair share of medical emergencies. “But when it comes to the science,” Ledwell says, “it has succeeded beyond my highest expectations.” Ledwell credits the strong partnership with the UK scientists. But the other DIMES researchers point to the exciting, multi-talented community involved in the experiment. “It is not all that common for a group of observers and modelers to get together around one particular experiment,” says Speer. “I think this tracer provided a central core for us all to rally around.”
In terms of their ultimate goal, the DIMES researchers hope that their data on ocean mixing provide the missing ingredients to ocean climate models, which can then be used to understand past climates, as well as improve projections about the future. “The biggest climate change signal is the change over the past one to three million years,” says Speer, “so if you can’t get that right, you can’t get the future right. And some of that understanding depends on what we find in the DIMES experiment.”

