Striving to understand, harness and sustain Earth's defining frontier.
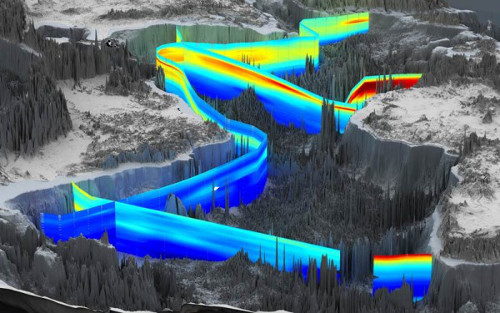
Tracking pollution: Red and yellow areas on a cross-sectional map of the Atlantic Ocean, highlight areas with relatively high traces of lead. 3D graphics by Steven van Heuven, courtesy Hein de Baar, Rob Middag, Abigail Noble, and Christian Schlosser