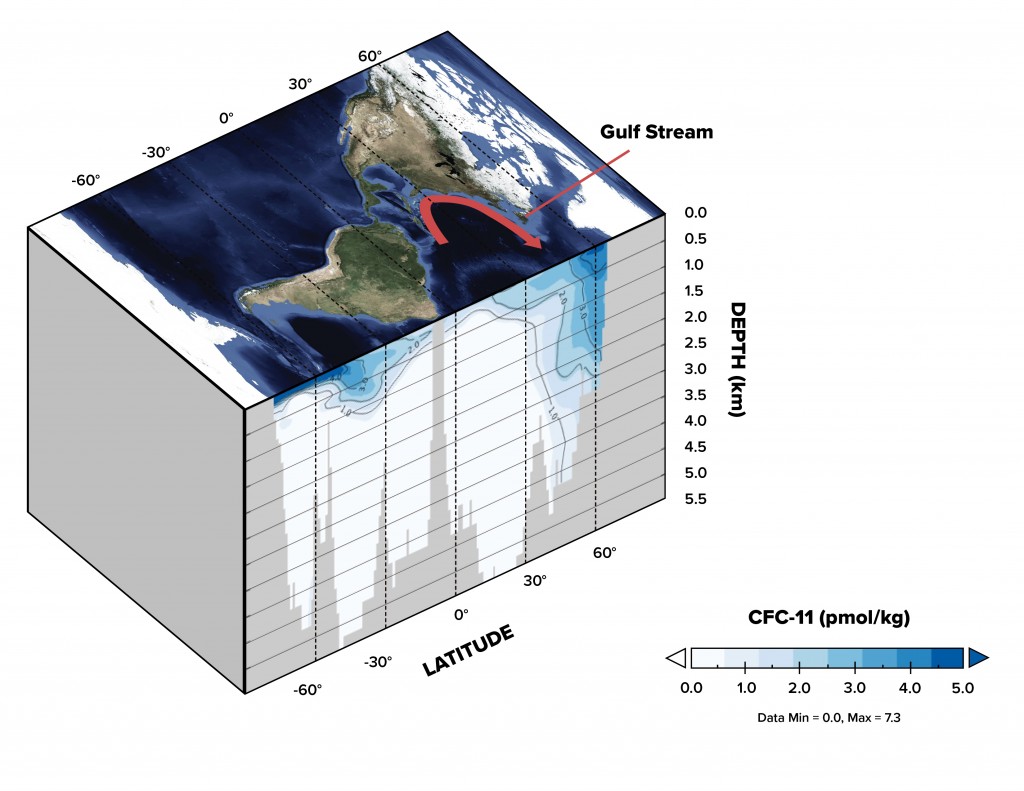
The red line on the map shows the Gulf Stream current, the surface portion of the Atlantic Meridional Overturning Circulation. Shown in shades of blue are the concentrations of CFCs at depth in the ocean. Nearer to the equator, the CFCs only occur at the surface. As the Gulf Stream current moves north, they begin to be drawn down to depth with the downward pull of the conveyor belt.
(Credit: NASA /Jenny Hottle)

