Featured Stories, MIT | May 30, 2013
Before the Wreckage Comes Ashore
A new application of dynamical systems theory paves the way towards next generation disaster response.
By Genevieve Wanucha
From the Fukushima tsunami disaster to the Deep Water Horizon oil spill, environmental disasters exact all-too-memorable damage to coastal communities. Imagine if it was possible to predict the exact place a blob of spilled oil or dangerous tsunami debris would hit a coastline two days ahead of time. Imagine if we could pinpoint where the pollution would never make landfall. Early detection, rapid-response actions, and efficient use of limited resources only hint at the potentials of smarter disaster response.

That dream is more of a reality now, thanks to a culminating decade of work in an environmental application of dynamic systems theory, a branch of mathematics used to understand complex phenomena that change over time. Oceanographers around the world, with MIT’s mechanical engineer Thomas Peacock at the helm, have found the invisible organizing structures that govern how pollutants move along the Ocean’s chaotically swirling surface.
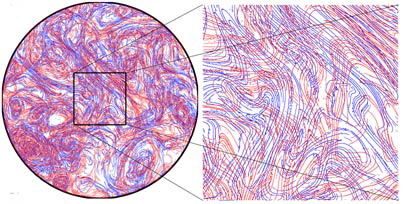
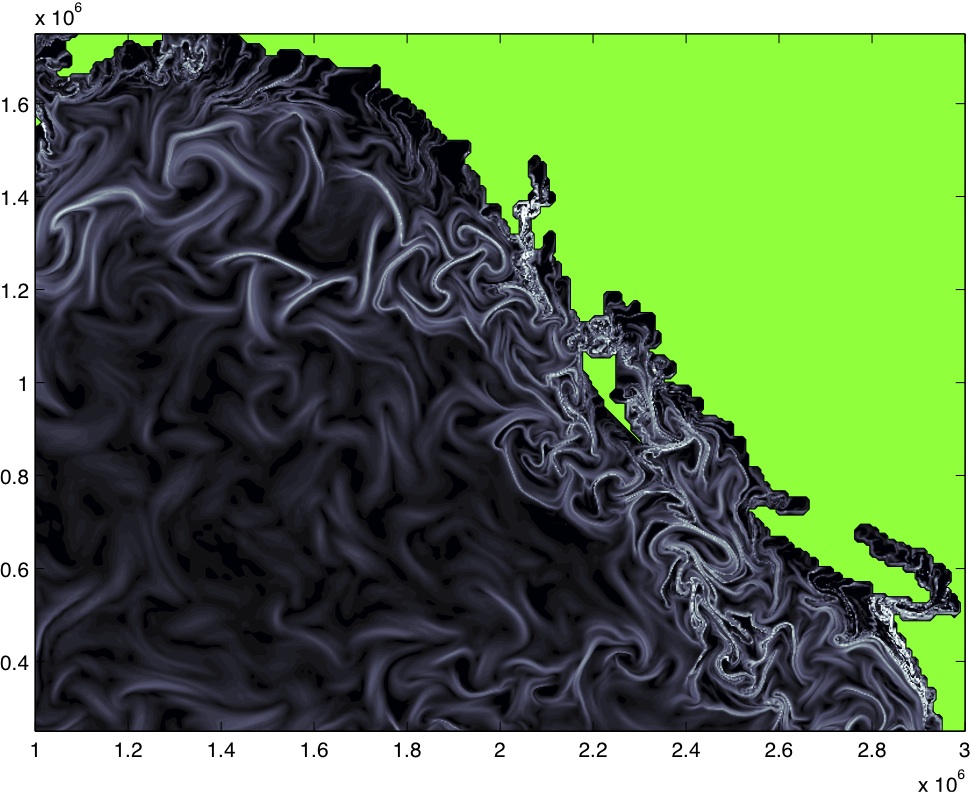
These structures, called Lagrangian coherent structures (LCS), are the dividing lines between parts of a flow that are moving at varying speeds and in different directions, often called the “hidden skeleton of fluid flow.” These curvy lines of water particles act to attract or repel the other fluid elements around them. “For example, if something is dropped in the Gulf stream,” says Peacock, “it would hit the coast of the United Kingdom, but dropped just outside of the Gulf stream, it would go off somewhere else, maybe down to the South Atlantic or up off to the North Pole.” The key, he says, is to find the LCS and identify them, which is a challenge for an ocean surface with flows that are constantly changing shape and form.
Peacock and his collaborators at MIT’s Experimental and Nonlinear Dynamics Lab are now applying the LCS approach to predict the path of debris swept out into the Pacific Ocean’s Kuroshio Current when the Tohoku tsunami hit the coast of Fukushima, Japan back in May 2011. Detritus has been washing ashore along the West coast of US and Canada and will continue to for at least 5 more years. The debris is not radioactive, but the rouge Japanese fishing boats and docks deliver dozens of potentially invasive organisms to the coastal ecosystems of the Pacific Northwest.
To locate and study the LCS guiding the debris to the US, Peacock’s group relies on data from high-frequency (HF) radar systems, buoys and satellites. They are increasingly benefiting from a strengthening infrastructure of high frequency radar installations, built along the West Coast by researchers at Scripps Oceanographic Institution. These monitoring stations provide a wealth of readily available, up-to-the minute data on ocean surface currents in real time. In tandem, the National Oceanic and Atmospheric Administration (NOAA) keeps close track of tsunami debris sightings and provides an online interactive map of the debris.

In the lab, computers capable of rapid processing apply the Lagrangian rules to these data, supporting the goal of Prof. Peacock to create a “nowcast,” which is an accurate map of the key transport barriers organizing the debris at the present time. The idea is that at any particular time of year, he can make a big picture statement about the particular regions of the West coast that are likely to attract the debris. “So far, we have identified time windows when there is a switch between where the stuff is going to be pushed up to the Gulf of Alaska and where its going to be pushed south towards Oregon and Washington,” he says. “These insights are substantial advances and nicely complement traditional modeling efforts.”
The common approach to tracking the fate of ocean contaminants involves running computer models that estimate the likelihood a pollutant will travel a certain path. “While certainly a powerful tool,” says Peacock, “direct trajectory analysis doesn’t really give you an understanding of why things went off to one location as opposed to another.” These traditional models produce what are unfavorably referred to as “spaghetti plots” because of their hard-to-decipher tangled lines of possible pollutant pathways. “The LCS analysis helps us process the trajectory information in a different way and identify key transport barriers to pollutant transport.”
The goal for the tsunami debris is to extend “now-casting” to forecasting, and this feat depends on the quality of data Peacock can get his hands on. “The holy grail in a few years time, say, will be to have the entire West coast peppered with the monitoring stations that can measure 100 kilometers or more out to sea,” he says. “With that information, we could then fairly accurately find all the attracting and repelling LCS and decide which regions we might expect something to come ashore or not.”
***
In April of 2010, a blowout caused an explosion on the Deepwater Horizon (DWH) offshore oil rig in the Gulf of Mexico, resulting in a 3-month spill of about 4 million barrels of oil. In the Lagrangian world, disaster is opportunity. In the years that followed, the enormous amount of satellite data from the unprecedented disaster became the single best way to hone LCS methods.

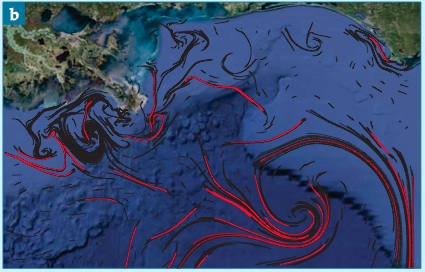
To validate the LCS results, researchers confirm their transport barrier predictions with a blob of tracer in water, capturing its motions, speed, and trajectory with high-resolution digital cameras. “Normally, you don’t have such a huge tracer blob in the ocean that’s so visible from the surface,” says George Haller, Professor of Nonlinear Dynamics at ETH Zurich, who forged this dynamical systems theory approach to questions about ocean surface transport. “So, the Gulf Oil Spill was almost the ideal tracer experiment.” In 2012, Haller and María J. Olascoaga of University of Miami identified a single, key LCS that had pushed the oil spill toward the Northeast coast of Florida for about two weeks in June–information that would have been key for hard decisions during the spill.
CJ Beegle-Krause has seen 250 oil spills. She is an oceanographer currently at the independent research organization SINTEF and serves as an oil spill trajectory forecaster for NOAA—which is why she got calls from high school friends asking if the Gulf Oil spill would reach their vacation homes. From her experience, she predicts that core-structure analysis will have huge social value.
For example, during the oil spill, the city of Tampa, Florida repeatedly requested resources from the Unified Command Center. “That was a very difficult situation, says Beegle-Krause, “because the oil was close enough to make residents and responders worried, but all the three-day forecasts did not show the oil reaching that coast.” People didn’t believe the government, and mass cancellations devastated the tourism industry. She thinks that LCS analysis could buffer a spill’s psychological impact. “My hope,” she says, “is that having transport barrier predictions as an independent source of information will reassure people and help them understand why they aren’t getting resources.” Just as with weather predictions, maps, animations, and pictures bring the message home more than tables of numbers and probabilities.
The big environmental potential for the LCS approach is optimized deployment of oil spill equipment, such as skimmers, dispersants and absorbent booms. “We can also develop a monitoring program based on transport barriers,” says Beegle-Krause, “so we can monitor less in areas that are outside of transport barriers that contain the spill.” Plus, she suggests, if responders had a heads up as to where the spill would break up into sheens, or very thin layers of oil, they could quickly decide not send skimmers out to those areas of unrecoverable oil.
Looking ahead to a time when the melting Arctic is home to increased oil exploration, Beegle-Krause can’t help but think of the insurmountable obstacles an oil spill in the region would pose without the next generation of response tools. “For example, in the Deepwater Horizon disaster, the entire spill was surveyed with data from satellites and helicopters within 24 to 48 hours,” she says. “But if there is a well blowout in the Arctic and oil gets under ice, it’s much harder to locate the spill and send appropriate resources. You can’t just fly over and see oil under pack ice.” Getting a handle on the spill would involve sending instruments through the ice in remote, frigid locations. Deep Water Horizon would look easy.
***
Back at the MIT Experimental and Non Linear Dynamics Lab, their LCS approach is going global, from Brazil to Taiwan, all the way off the northwest coast of Australia to the Ningaloo Reef, a World Heritage ecosystem facing oil spill threats from close proximity offshore facilities in operation, as well as planned exploratory drilling. But the reef has guardians. Peacock and collaborator Greg Ivey, Professor of Geophysical Fluid Dynamics at University of Western Australia, are analyzing the complex flow fields that prevail in the waters off Ningaloo. They hope to determine when the reef is at high risk and how long those danger periods last.
So, what if an another spill the size of Deep Water Horizon happened today? “We would be in a better position than we were at the time,” says Beegle-Krause. “We have the analysis method. But we don’t have a product ready yet that responders can use to make decisions in a spill. That’s what needs to happen—the transition from peer-reviewed science to a decision support product.” Beegle-Krause and Peacock are now collaborating on such an industry product. She estimates that with all necessary funding, the product could be ready in two years.
If there ever was at time to push this application forward, this is it. In the last three years, we experienced the largest accidental marine oil spill in the history of the petroleum industry and the largest accidental release of radioactive material into the ocean, along with 5 millions tons of debris. “That has certainly made funding agencies sit up and take notice,” notes Peacock who has recently received new funding from the National Science Foundation and Office of Naval Research to advance these methods. These familiar disasters are, inevitably, not the last marine “accidents.” If we can’t prevent the disasters, we might as well beat the wreckage to the shore.


