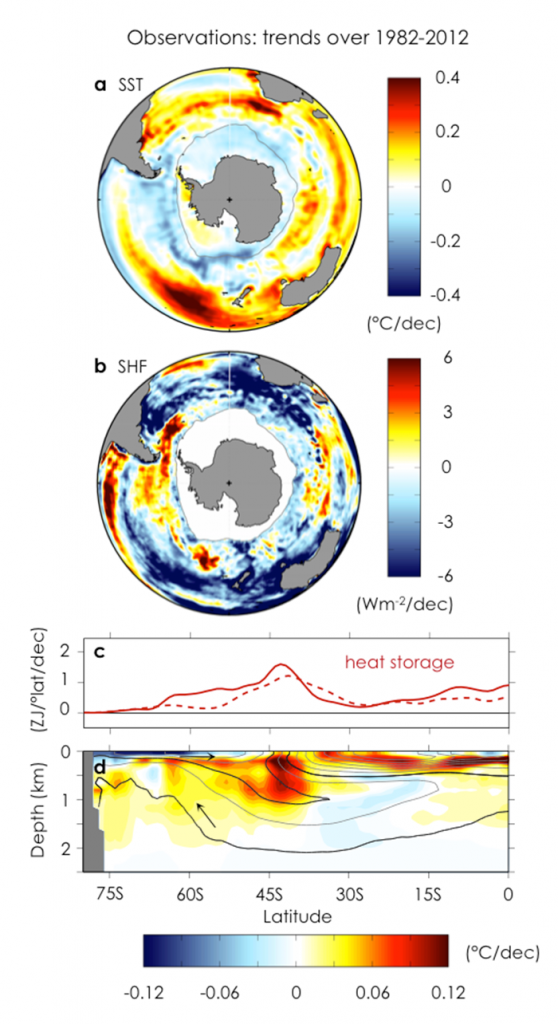
Observed trends over 1982–2012. a, Annual-mean sea surface temperature trend.
b, Net surface heat flux trend (positive into ocean). c, Zonally and depth-integrated ocean heat content trends from two di erent subsurface temperature data sets. d, Zonal-mean ocean potential temperature trend with contours of climatological ocean salinity. Arrows indicate the orientation of the residual-mean MOC following along contours (black lines). Grey line in a and b shows maximum winter sea-ice extent. (Image courtesy of the authors)

